No memes, no introductions, lets get straight back in to this.
TLDR and summary of the last 2 newsletters.
Win Rate and Expectancy alone can build you a strategy to beat SPY.
Recap first
Real quick, this is a follow up in my series digging in to specific quantitative statistics and how to build strategies around them. Find the previous two entries linked below.
The statistics in the title are quickly becoming my 3 pillars of strategy building. This has been a fun project to embark on so far! Normally I’m more of a portfolio design kind of person, taking existing pieces and balancing them against eachother in a logical, “all weather” allocation kind of way. This is similar, but an illuminating process of learning about “alternative” ways of construction a…. strategy? I struggle to call this a portfolio, despite the diversity of asset classes involved in these compilations.
So, next steps?
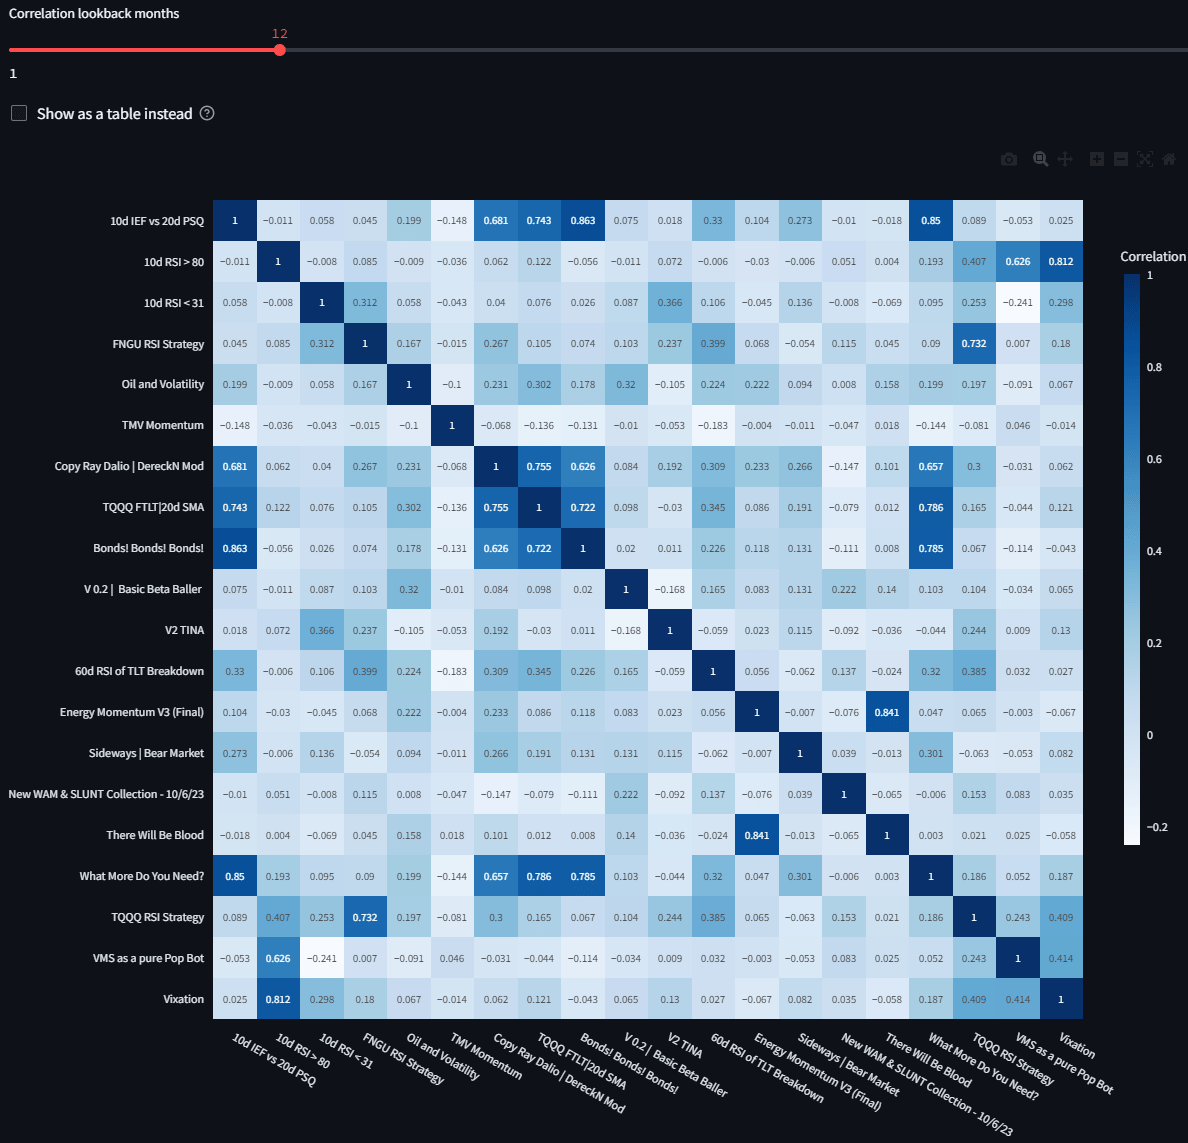
Starting from the strategy as we left off, the next step is elimination of undue correlation. To keep it systematic, we’re running batches of 20 strategies through at a time, and switching up to the 12 month timeframe.

Batch 1

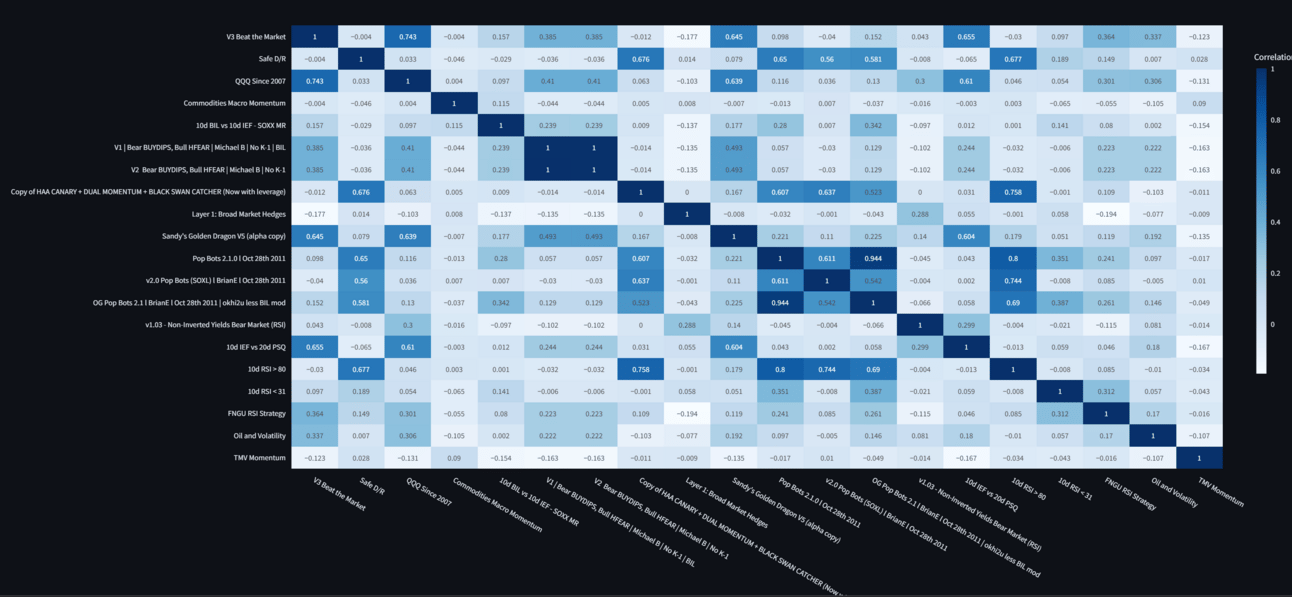
Batch 2
I’ve decided on 6 being the magic number of “highly correlated” things before something starts getting cut. I’ve decided on 6 as the admittedly arbitrary number of correlations, over .6% 40% of movement being correlated is just the number I’m comfortable with, but I’m very open to other methods of pairing this list down.
Batch 1 is going to have 3 cuts;
Max Drawdown Black Swan Catcher |
TQQQ UVXY Levels |
SPY UVXY Levels |
V2 Bear BUYDIPS, Bull HFEAR | Michael B | No K-1 |
Batch 2 is…. pretty clear, actually. No real changes needed.

Batch 3
There we go, that’s a clear group 3.
Now, we mix and match a few more groups, and we end up with a final cut list that looks something like this.
Max Drawdown Black Swan Catcher |
TQQQ UVXY Levels |
SPY UVXY Levels |
V2 Bear BUYDIPS, Bull HFEAR | Michael B | No K-1 |
v1.03 - Non-Inverted Yields Bear Market (RSI) |
Vol-ey Wolley Mashup Remix [No VIXM] V2.0 |
Idk Part Too |
Sandy's Golden Dragon V4.4 (vol hedge?) |
Vixation |
New WAM & SLUNT Collection |
Max Drawdown Black Swan Catcher |
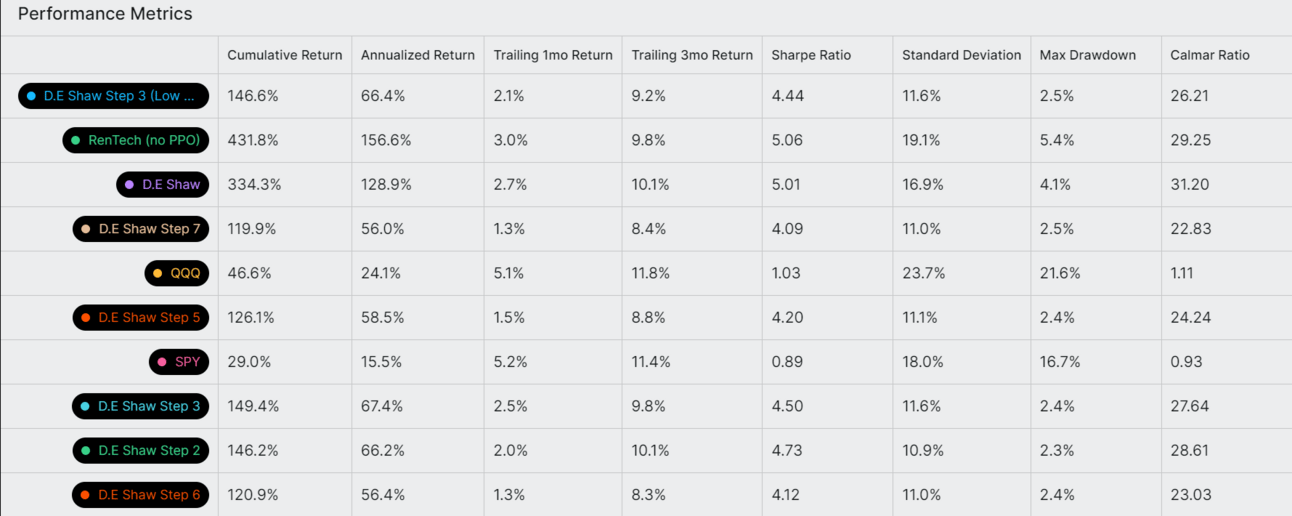
TaDaaaaa, this gives us Step 3.
It doesn’t strike me as meaningfully different than step 2. I’m both unimpressed, but impressed at the same time that taking ~11 strategies out of a group of roughly 50 does so little over the course of the backtest.
Seems like a solid place to call it.
Inevitably, I cannot do that. Too many ideas and options.
Now, in the process of experimenting, I seem to have lost step 4. I think I may have saved over in in the JSON import/export process. A shame, truly on par with the burning of the Library of Alexandria. However, the fruit of the labor was still harvested. The entire JSON editing process was an endeavor to lengthen the backtest, and perhaps cut down on the massive ticker universe involved in this symphony. The next most notable step, in my opinion, is labeled 7 despite actually just being 6 due to several rounds of back and forth bulk editing. SHY/SHV all become BIL, single tickers are cut out of most/all subsections leaving only ETF’s. I cut down on ETF’s by combining ETF’s with a correlation of at least .9, regardless of changes in leverage.
All this is done to say that I don’t necessarily think I’d put money in 5 or 7. They are, more or less, there to prove a point. The stats on Step 1, 2 and 3 are likely inflated. Possibly due to overfitting for newer tickers, possibly just benefitting from having been in a mostly bull market for the majority of the backtest time. My portfolio will be containing step 3, and likely the original RenTech (NoPPO) that Dereck Nielsen created that started this whole adventure for me. That said, here’s what I’ve arrived at for a “final” version of Step 3. I’ve removed “Low Volume tickers” like NRGU in favor of OILU, OILK out in favor of UCO, gathered the list of 4 non-fractionable tickers, OILU, VIXM, FNGD, VIXY, TECS, ERX, etc.
So, what have we learned as we wrap this journey up?
Well, the clearer your plan is in the beginning, the better your strategy is likely to be. I genuinely agree with the idea that Low Volume Cleaned Step 3 is the “best” iteration of this strategy, even if it isn’t the highest Calmar. It sticks with the '“as close to unedited, everything that fits the Win Rate/Expectancy criteria”, and only makes changes to make reliable running a little better.

Now, there has to be bad news. A downside of sorts. Because of the sheer number of tickers in the strategy, and how many of them are non-fractionable, in order to not end up in a cash position of over 1% at any point in the backtests, you need to have somewhere in the area of $8500 - $10,000 allocated to the strategy. Now, that isn’t the minimum needed to run the strategy, that number is somewhere around $500 - $1000 to account for inevitable reverse splits and increases in minimums.


